
Traditional credit scores measure the borrower. ForeScore measures everything around them - the local economic, housing, and demographic conditions that drive defaults, prepayments, and loan value at the ZIP code level.
Who Uses ForeScores?
- Lenders: sharpen underwriting and regional strategy, tightening standards in deteriorating markets and expanding confidently in strong ones.
- Investors: assess geographic risk concentration in whole-loan and securitized portfolios before committing capital.
- Insurers: strengthen underwriting with localized economic intelligence that borrower-level data can't provide.
 Key Benefits of UFA’s ForeScore
Using geographic data provides a richer context for financial assessments. Here’s how our tool empowers smarter decisions:
- Risk and opportunity detection: Spot high-risk or high-reward lending regions before issuing loans.
- Smarter underwriting: Complement traditional criteria (credit score, income, assets) with regional factors like job stability, property trends, and economic shifts.
- Portfolio strength: Reduce charge-offs, support predictable returns, and increase investor confidence through strategic area targeting.
- Highlight regional risks: ForeScore proactively identifies risks that shape loan performance. Lenders can cut exposure, price more accurately, and build portfolios anchored in stable, growth‑ready neighborhoods.
 How ForeScores are built
UFA analyzes large loan datasets to isolate the location effects on loan performance, drawing on:
- Economic indicators: employment, income trends, collateral forecasts, and business activity by area.
- Demographics: population growth, age distribution, education, and migration patterns that shape long-term demand.
- Lifestyle and environmental factors: school quality, crime rates, infrastructure, and natural-disaster exposure.
UFA then uses its econometric model of local economies to forecast the relevant variables over the life of loan. The output is a single, model-ready score per ZIP code that plugs directly into your existing PD, LGD, and pricing models.
UFA ForeScore™ Default
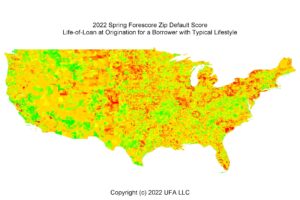 Usually the second or third most important variable in credit analysis - comparable in impact to credit score.
ForeScore Default quantifies how local economic conditions, demographics, and environmental factors change the probability that loans in each ZIP code will default.
UFA ForeScore™ Value
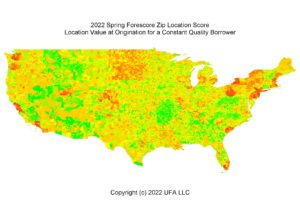 Location-driven differences in profitability can reach 20% of loan value on any given date - and up to 50% across origination dates. ForeScore Value forecasts the future cash flows of a loan in each location, so you can see exactly where identical loans are profitable and where they aren't.
How It Works UFA forecasts the future cash flows on a loan based on economic conditions, demographics, environmental conditions, and lifestyle variables. The future cash flows on a loan when combined with the current cost of funds provide the differences in the profitability of a loan at each location.
ForeScore FAQ
ForeScore is a geographic risk tool from University Financial Associates that predicts how current and forecasted future economic conditions will affect loan performance. Rather than scoring individual borrowers, Forescores measure area-level default, prepayment, and value risk at the ZIP code level and outputs a numeric score lenders can plug directly into their credit models.
What it measures:
ForeScore quantifies how local economic strength, housing market health, and demographic trends in each area influence loan defaults, prepayments, and long-term value. It answers: "Does this location make loans riskier or safer?"
How it improves credit risk models:
- Default prediction (PD) – Captures location-driven default risk that borrower credit scores miss
- Loss estimation (LGD) – Links recovery rates to local housing values and economic resilience
- Exposure forecasting (EAD) – Reflects geographic patterns in credit line usage and prepayment behavior
Real-world applications:
Underwriting – Adjust approval rates, pricing, and loan limits by geography. Tighten standards in declining markets while expanding in strong areas.
Portfolio management – Identify geographic concentration risk, stress test regional exposures, and spot vulnerable markets before losses emerge.
Securitization – Compare regional risk across loan pools and allocate capital toward stable geographies.
Bottom line: ForeScore adds a location layer to traditional credit scoring, recognizing that identical borrowers carry different risks depending on where they live. It helps lenders make smarter decisions about where to lend, how to price risk, and which markets need closer monitoring.
Credit risk modeling builds statistical tools to estimate default probability and losses, while credit risk assessment is the broader decision-making process that combines those model outputs with human judgment to evaluate a borrower's creditworthiness.
Credit risk modeling creates data-driven tools that produce standardized metrics like probability of default (PD), loss given default (LGD), and exposure at default (EAD). These models use techniques such as logistic regression, credit scorecards, or machine learning trained on credit histories, financial statements, and economic data. Risk analytics teams use these validated, repeatable outputs to inform pricing, provisioning, and regulatory capital requirements.
Credit risk assessment is what credit officers and underwriters actually do when making lending decisions. They take model-generated scores and combine them with qualitative factors—management quality, industry conditions, business model strength, collateral value, and market risks. This judgment-intensive process results in actionable decisions: loan approvals or declines, credit limits, pricing terms, and covenants.
In short, modeling provides the analytical tools, while assessment uses those tools plus human expertise to make final credit decisions.
Bureau data treats two borrowers with identical profiles as equally risky, even if one lives in a thriving market and the other in an area losing employers. Location variables capture local unemployment, housing trends, and default clustering, improving both risk discrimination (separating high- from low-risk loans) and calibration (predicted vs. actual default rates).
Enhances predictive models
Geographic information allows models to incorporate local economic factors that drive default risk:
- Regional unemployment rates and job market conditions
- Property values and housing market trends
- Neighborhood income levels and economic stability
Spatial modeling shows how risk clusters geographically—a borrower in a high-default area carries higher modeled risk even with a strong personal profile. Research proves that adding neighborhood characteristics and spatial patterns significantly increases correctly forecasted defaults, improving both probability of default (PD) and loss given default (LGD) estimates.
Improves credit decisions
Geographic tools help credit officers make smarter decisions:
- Risk heat maps reveal emerging problem areas for targeted underwriting adjustments
- Portfolio concentration reports identify overexposure to vulnerable regions
- Neighborhood indicators provide context for thin-file borrowers when credit history is limited
This location-based approach is especially valuable in underserved markets, enabling lenders to safely approve more borrowers while maintaining quality.
Strengthens fraud prevention
Geographic verification improves data reliability:
- Confirms stated addresses match actual locations via IP or mobile data
- Flags identity fraud when location data doesn't align
- Detects suspicious patterns like application clusters from the same area
By improving both model inputs and decision-making context, geographic data makes credit risk management more accurate, inclusive, and secure.
Default and prepayment risk models use overlapping but distinct factors. Default models focus on ability and willingness to pay, while prepayment models emphasize economic incentives to refinance or repay early.
Borrower-level factors
For default risk:
- Credit history – credit scores, past delinquencies, bankruptcies, and credit history length
- Financial health – income, debt-to-income ratio, cash flow, and credit utilization
- Demographics – age, employment status, and repayment behavior patterns
For prepayment risk:
- Higher credit scores and income levels (these borrowers refinance more readily when rates drop)
- Liquidity and ability to pay down principal early
Loan and collateral characteristics
Both models rely heavily on loan terms:
- Contract details – interest rate, maturity, amortization schedule, and prepayment penalties
- Loan structure – fixed vs. variable rates, loan-to-value ratio (LTV), and collateral quality
High LTV and weaker collateral increase default risk. Prepayment models especially track the refinancing incentive—the gap between the borrower's current rate and market rates—since this drives early payoff decisions.
Economic and market conditions
Macro factors affect both risks:
- Economic indicators – unemployment, GDP growth, income trends, and property values (defaults rise in recessions)
- Interest rate environment – falling rates typically reduce defaults but increase prepayments, especially on fixed-rate loans
- Credit spreads – market pricing of credit risk
Corporate-specific factors
For business borrowers, models add:
- Financial ratios – profitability, leverage, interest coverage, and liquidity
- Market signals – equity prices, volatility, and debt valuations
In summary, default models prioritize solvency and payment capacity, while prepayment models focus on refinancing incentives, particularly the difference between contract and current market terms.
In loan valuation, to adjust pricing by geography. In portfolio management, to identify concentration risk and stress-test regional exposure. In securitization, to compare risk across loan pools and allocate capital toward stable geographies.
Geographic factors require governance, since location can correlate with protected characteristics. UFA conducts periodic disparate-impact monitoring and explainability checks to meet ECOA, Reg B, the Fair Housing Act, and HUD’s disparate‑impact compliance framework.
 Consult with UFA Today
By combining traditional credit risk modeling with real-world geographic data, UFA’s ForeScore tool unlocks deeper insights into loan behavior and performance. Whether underwriting new loans, managing a portfolio, or investing in securitized assets, this tool strengthens risk management at every stage.
Reach out to our team to learn more about UFA’s strategies and explore how our tools can enhance your credit decision-making.