Why falling millage rates can amplify housing booms and deepen busts
Most people think of the property tax as a dull, stable partof owning a home. It isn’t. In the housing market, it behaves more like anaccelerator.
Consider the past decade. Across the 50 states and DC, realhouse prices rose about 40% from 2015 to 2025. Over the same years, the averageproperty tax millage rate fell from 1.48% to 1.20%.
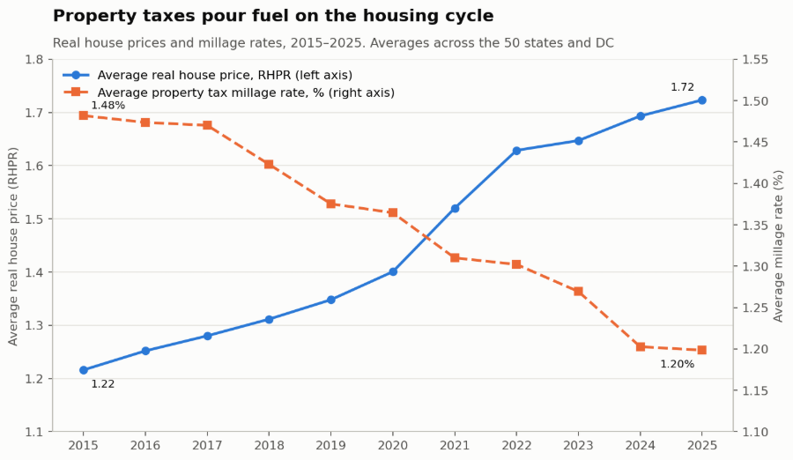
Is this a coincidence? We don’t think so. In this post welay out why falling millage rates and rising prices go together, show that eachone predicts the other in the data, and explain why this matters for anyone wholends against, invests in, or forecasts house prices.
How budgets set the tax rate
Local governments don’t start with a tax rate. They startwith a budget, and the rate is whatever it takes to fund it. When home valuesclimb, a smaller rate raises the same money. Many states go further. Rollbackrules and assessment caps require rates to fall as assessed values rise. Sorising prices bring falling millage, almost by design.
How the tax rate sets the price
Now look at it from the buyer’s side. A home’s pricereflects what it costs to own. Mortgage interest, maintenance and propertytaxes are all part of that bill. Economists call the total the user cost ofhousing. Cut the tax, and the user cost falls. Buyers take the savings andspend it on more house. Prices rise again.
The effect is not small. Suppose the user cost of a home isabout 6.5% of its value each year. Then a permanent cut of one percentage pointin the tax rate should raise the price by roughly 15%. Even the modest declinesof the past decade matter at that scale.
What the data show
We tested both links with a panel of the 50 states and DCfrom 2015 to 2025. Each regression includes state and year fixed effects. Theyear effects remove anything common to the whole country, such as mortgagerates and inflation, so the results compare states with each other. We smoothedmillage rates over three years to remove one-time spikes.
- Lower millage raises prices. We regressed the level of real house prices on last year’s millage rate. A state with millage 0.1 point lower has real prices about 0.9% higher (p < 0.01). The average decline over the decade implies real prices roughly 2.5% higher. The estimate is a large share of what the user-cost model predicts. If assessed values sit below market values, as they often do, it is closer still
- Higher prices lower millage. Ten points of extra real price growth is followed by a millage cut of about 0.06 points the next year (p < 0.05).
Both results use last year’s values to predict this year’s.The timing runs the way the story says it should.
A loop, not a line
Put the two links together and you get a feedbackloop:
- Prices rise
- Millage falls to hold revenue steady
- Owning gets cheaper
- Prices rise further
The loop runs in reverse too, and that is the worrying part.When prices fall, localities raise millage to protect revenue. Ownership costsgo up just when households and markets are weakest. A tax that should steadythe market ends up adding to the swing.
Economists usually praise the property tax as a stablesource of local revenue. Stable for the treasury, perhaps. For the housingmarket, it is procyclical. It amplifies booms and deepens busts.
Why it matters for lenders and investors
A mortgage is a bet on the collateral. Anything that makeshouse prices swing harder raises the risk in a loan portfolio. That risk isuneven across places, because rollback rules, assessment practices and budgetpressures differ from state to state and town to town.
Models that treat property taxes as a fixed cost will missthis. They will understate how far prices can run up in a boom and how far theycan fall in a bust. For credit risk, loss forecasting and stress testing, theproperty tax belongs in the model as a moving part.
Why it matters for policy
Rate-rollback rules and assessment caps are sold asprotection for homeowners. They may also be quietly fueling the cycles thathurt homeowners most. Policymakers who want steadier housing markets shouldlook at how their tax rules respond when prices move.
About the data
House prices are annual state-level real house price indexes. Millage rates are average state property tax millage rates. The capitalization estimate regresses 100 × ln(real house price) on the prior year’s three-year median millage rate, with state and year fixed effects and standard errors clustered by state (coefficient −8.9, s.e. 3.2). The feedback estimate regresses the change in smoothed millage on the prior year’s real price growth, with the same controls (coefficient −0.006, p = 0.04).