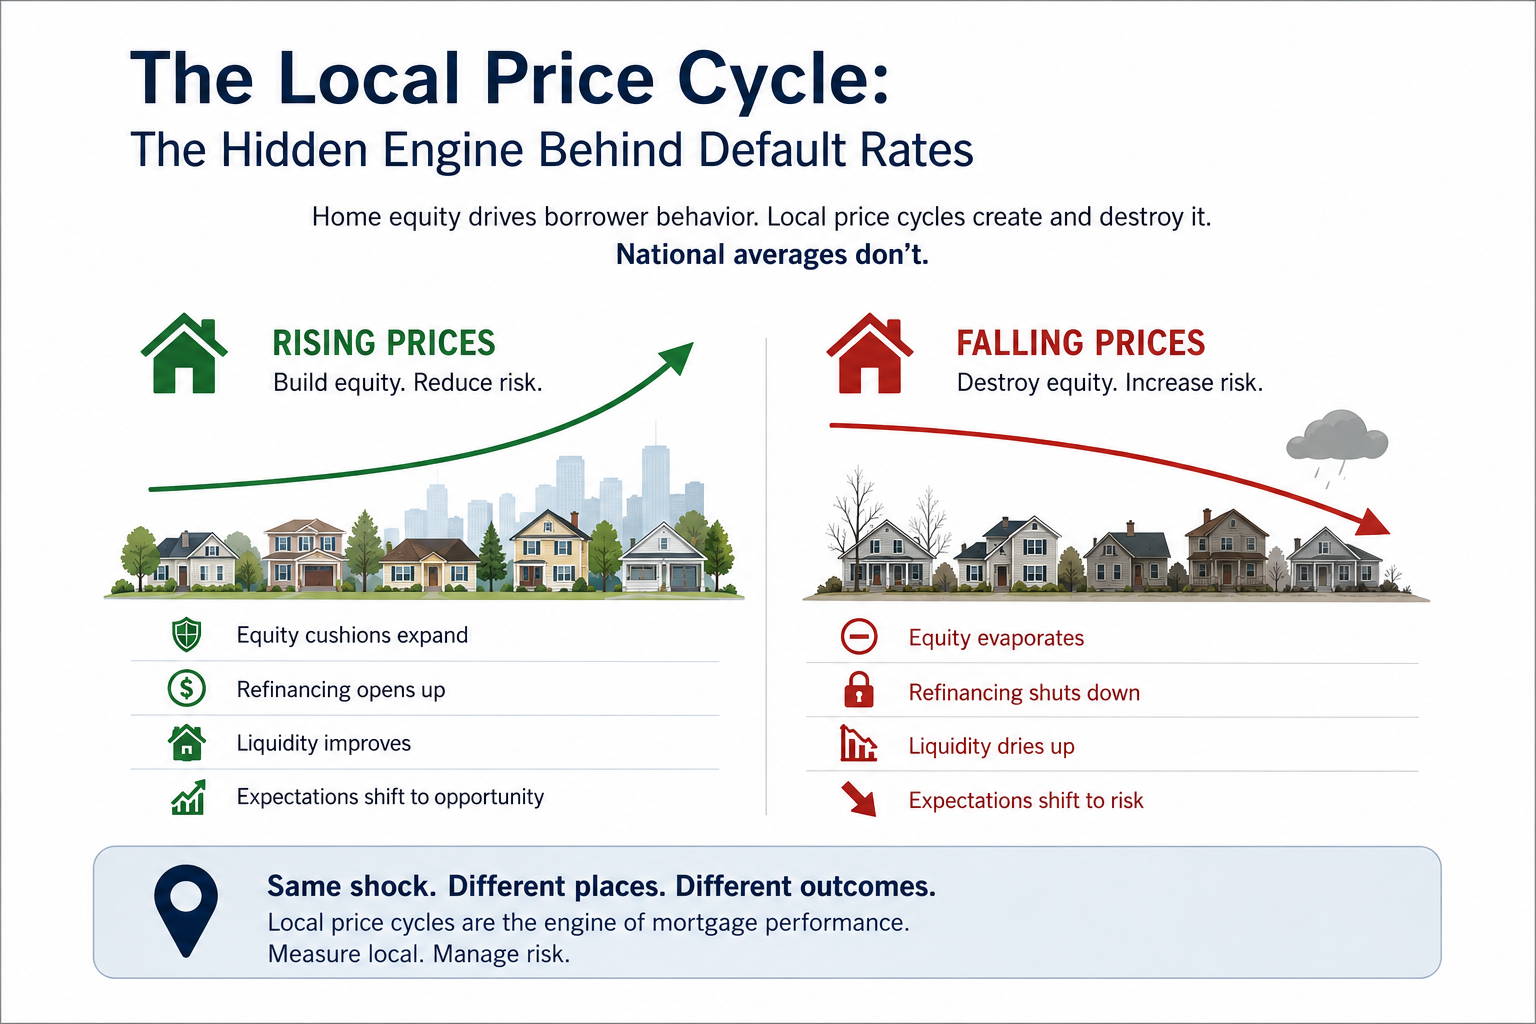
The earlier post, "Why Mortgage Risk Is Local, Not National," argued that default is a local phenomenon. This post explains why. Home equity is the fulcrum of borrower behavior, and local price cycles create and destroy it. National averages don't.
This is the central insight. Practitioners find it obvious. Yet many models leave it out. Borrowers don't respond to "the housing market" in the abstract. They respond to their block, their ZIP code, and the price signals that shape what they expect to happen next.
In short: people default locally because they live locally.
Local Appreciation: The Quiet Architect of Stability
When neighborhood prices rise, several reinforcing effects kick in at once:
- Equity cushions expand. This reduces both strategic default and the odds that a shock pushes a household underwater.
- Refinancing opens up, lowering payments or unlocking liquidity.
- Market liquidity improves, so selling becomes a real alternative to falling behind.
- Expectations shift. Rising prices start to look like opportunity instead of risk.
Even modest appreciation can reshape behavior dramatically. A borrower with a thin equity buffer in a rising neighborhood is not the same economic actor as that same borrower in a stagnant one. Their incentives, constraints, and sense of the future diverge.
Local Depreciation: The Asymmetry of Loss
Price declines trigger the same mechanisms in reverse, but with a twist: losses aren't simply the mirror image of gains. They're more dangerous.
- Equity evaporates fast, especially for recent buyers.
- Negative equity appears, the single strongest predictor of default.
- Refinancing shuts down, trapping borrowers in higher-cost loans.
- Liquidity dries up, making distressed sales harder to pull off.
Here's the key empirical point: identical percentage declines don't produce identical outcomes.
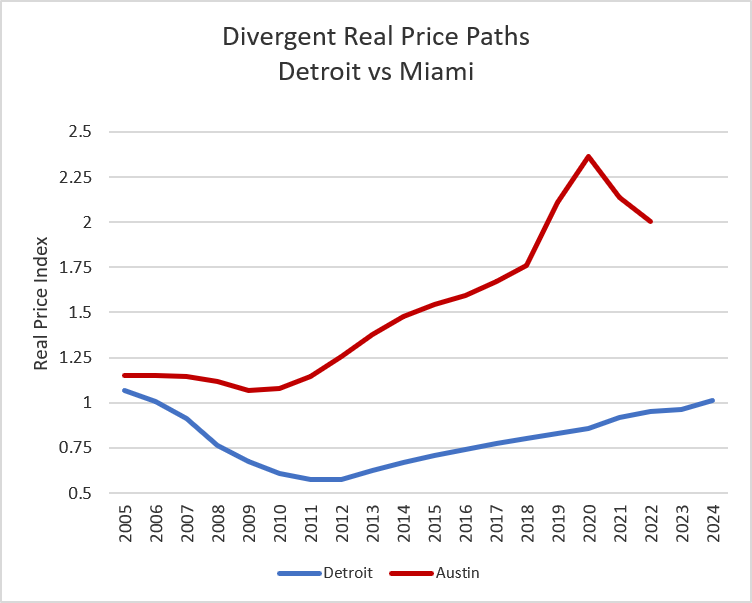
A 10 percent drop in Phoenix, a volatile, boom-prone market, can push a large share of borrowers underwater. The same 10 percent drop in Boston, a tight, supply-constrained market, barely touches accumulated equity.
Same shock, different worlds.
Negative Equity: A Spatially Clustered Condition
Negative equity doesn't spread like mist across a metro. It clusters like a contagion:
- In neighborhoods with high price volatility
- In areas with recent construction booms
- In ZIP codes with high leverage at origination
- In markets with cyclical employment bases
Two ZIP codes can see the same average price decline and still end up with radically different numbers of underwater borrowers. One neighborhood spirals into distress. The other absorbs the shock and moves on.
This is why national HPI measures mislead. They flatten the very distribution of equity losses that determines default.
Nonlinearity: The Cognitive and Economic Pivot Point
One of the research's most important findings is that default behavior is nonlinear:
- Default risk rises slowly as equity declines.
- It accelerates as equity nears zero.
- It spikes once borrowers go underwater.
This is nonlinear psychology layered onto nonlinear economics. People tolerate small losses. They don't tolerate hopeless ones. A neighborhood that dips slightly into negative equity can see a cascade of defaults, while a similar neighborhood that stays just above water holds steady.
Small differences in local price paths produce large differences in outcomes.
Why This Matters for Modern Mortgage Analytics
For anyone building or validating mortgage risk systems, the implications run deep:
- PD models need local price paths, not national aggregates.
- Stress tests need to simulate shocks that vary by geography.