Flip one coin and you cannot say how it will land. Flip ten thousand and you can predict, almost exactly, that half will come up heads. Mortgage pools rest on the same logic. One borrower may lose a job or fall ill. Among thousands of borrowers, those misfortunes arrive at different times and average out.
The logic has a catch. It works only when each coin is flipped on its own. A household's bad luck is its own, but a town's bad luck is shared. When the RV plants in Elkhart lay off a third of their workers, or the housing boom in Stockton ends, hundreds of borrowers in the same place struggle at the same time. Their troubles do not cancel. They pile up.
So the number of loans in a pool says less than it seems to. A pool of 5,000 mortgages can still be a bet on a few dozen local economies. To know how risky it is, you have to know where the loans are.
What we measured
We looked at 59 mortgage pools sold to investors in 2006 and 2007, at the peak of the housing boom. Together they held 216,564 loans worth $52 billion. Most were subprime, made to borrowers with weak credit. A dozen were prime or Alt-A, made to borrowers with stronger credit.
We gave each loan a ForeScore. ForeScore ignores the borrower entirely. It knows nothing about credit scores, down payments or incomes. It measures one thing: the economic environment the loan's location would face over the life of the loan, as of the day the loan was made. The scale is simple. A score of 1.0 equals the average loss rate on all loans in the 1990s. A score of 2.0 means twice that.
We then combined the loan scores into one score for each pool. There is nothing special about these pools. They are simply large, public and well documented, which makes them a good place to test an idea. The same test works on any bank's loan book or any portfolio of servicing rights.
Big pools, different economies
If pooling "diversified away" place risk, these pools should have looked alike. They did not. Their ForeScores ran from 1.65 to 3.65. The loans in the riskiest pools faced local economies that would push defaults more than 120 percent higher than the loans in the safest pools faced.
These were not small or narrow pools. Most held thousands of loans in more than a thousand ZIP codes, usually across nearly every state. Nor does timing explain the gap. In just three months, April to June 2007, 16 pools ranged from 1.99 to 3.65.
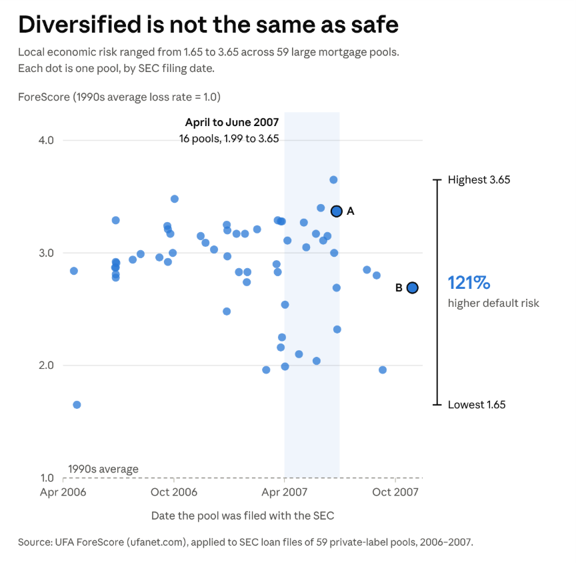
Even among large, national pools, the local economic risk ran from 1.65 to 3.65.
Could the spread simply reflect different borrowers? Pools A and B, marked on the chart, say no. Countrywide sold them four months apart in 2007. Each held about 3,000 loans spread across all 50 states and more than 2,000 ZIP codes. Their borrowers had the same average credit score and put down the same share of the price. On paper, pool B even looked slightly worse. But pool A's loans faced local economies with 3.4 times the 1990s loss rate. Pool B's faced 2.7 times.
An investor reading the standard pool statistics could not have told these two apart. The difference was not who the borrowers were. It was where they lived.
One more fact stands out. Not a single pool scored below 1.65. Every pool, even the safest, faced local economies riskier than the 1990s average. Most sat at two to three times that level.
Why the standard measures miss it
Credit scores and loan-to-value ratios describe the borrower and the loan. They are silent about the town. Two borrowers with a 600 credit score look identical on a spreadsheet. One may live in a metro area where jobs are growing. The other may live in one where a building boom is about to go bust.
Pools also inherit the geography of the lenders behind them. Lending is local. Brokers, builders and loan officers cluster where demand is hottest, and the hottest markets can be the ones closest to a turn. A pool assembled from a lender's busiest offices carries that lender's map, however many states it touches. Counting states and ZIP codes measures breadth. It does not measure exposure.
What it means for any loan portfolio
None of this is just history. Every mortgage portfolio today has a geography, and that geography carries risk.
- Loss reserves. Under CECL, the accounting rule that makes lenders reserve for expected lifetime losses, two books with the same credit profile can need very different reserves. A model that sees only the borrowers will set them the same.
- Stress tests. Downturns are national in the headlines and local in the losses. A book concentrated in fragile markets will lose more than its averages predict.
- Buying loans or servicing rights. A buyer who compares two packages on credit score and loan-to-value is comparing only half the risk.
The remedy is straightforward. Score the place as well as the borrower. Add up the place risk across the whole book. Then compare books on both.
The takeaway
The law of large numbers is a powerful tool, but it comes with fine print: the risks must be independent. Borrowers, for the most part, are. Places are not. A pool of loans is only as diversified as the local economies behind it.
Before the crisis, investors counted loans and counted states. They should have asked where the loans were, and what kind of places those were. It is still the right question to ask of any loan book today.
How much place risk is in your book?
UFA can score any loan portfolio, from a bank's mortgage book to a package of whole loans or servicing rights. We show how much place risk it carries, where that risk is concentrated, and how it compares with other books.
Try it on your own loans, free. Send us a sample loan file and we will score it at no cost. You will see how much place risk it carries and where that risk sits. To get started, contact us at ufanet.com/contact.